Benchmarks
This page contains benchmarks of all models implemented in GraphVite, including their time and performance. All experiments are conducted on a server with 24 CPU threads and 4 V100 GPUs.
Node Embedding
We experiment node embedding models on 3 datasets, ranging from million-scale to half billion-scale. The following table shows the size of each dataset, as well as the time and resource required by LINE model.
Dataset |
|V| |
|E| |
Training Time |
GPU memory cost |
|---|---|---|---|---|
1.1M |
4.9M |
1.17 mins |
4 * 801 MiB |
|
1.7M |
23M |
3.54 mins |
4 * 943 MiB |
|
7.9M |
447M |
1.84 hrs |
4 * 2.42 GiB |
The learned node embeddings are evaluated on the standard task of multi-label node classifcation. We report micro-F1 and macro-F1 of each model, with regard to different percentages of training data.
%Labeled Data |
1% |
2% |
3% |
4% |
5% |
6% |
7% |
8% |
9% |
10% |
|
|---|---|---|---|---|---|---|---|---|---|---|---|
Micro-F1 |
37.41 |
40.48 |
42.12 |
43.63 |
44.47 |
44.83 |
45.41 |
45.77 |
46.11 |
46.39 |
|
38.36 |
40.61 |
42.17 |
43.70 |
44.44 |
44.97 |
45.47 |
45.73 |
46.12 |
46.25 |
||
37.91 |
40.59 |
42.37 |
43.56 |
44.32 |
44.94 |
45.40 |
45.77 |
46.07 |
46.41 |
||
Macro-F1 |
30.77 |
33.67 |
34.91 |
36.44 |
37.02 |
37.27 |
37.74 |
38.17 |
38.35 |
38.51 |
|
30.90 |
33.69 |
34.88 |
36.40 |
36.75 |
37.44 |
37.89 |
38.07 |
38.30 |
38.40 |
||
30.70 |
33.69 |
34.84 |
36.17 |
36.45 |
37.42 |
37.68 |
38.05 |
38.32 |
38.62 |
See also
Configuration files:
deepwalk_youtube.yaml
line_youtube.yaml
node2vec_youtube.yaml
For larger datasets, node2vec fails with out-of-memory error, as it requires more than 200 GiB memory to build alias tables for the 2nd order random walks.
%Labeled Data |
10% |
20% |
30% |
40% |
50% |
60% |
70% |
80% |
90% |
|
|---|---|---|---|---|---|---|---|---|---|---|
Micro-F1 |
62.98 |
63.44 |
63.72 |
63.71 |
63.79 |
63.69 |
63.80 |
63.93 |
63.92 |
|
63.05 |
63.45 |
63.69 |
63.73 |
63.79 |
63.82 |
64.00 |
63.69 |
63.79 |
||
Out of Memory |
||||||||||
Macro-F1 |
61.72 |
62.12 |
62.36 |
62.38 |
62.42 |
62.36 |
62.44 |
62.58 |
62.55 |
|
61.77 |
62.14 |
62.35 |
62.39 |
62.46 |
62.45 |
62.64 |
62.28 |
62.45 |
||
Out of Memory |
||||||||||
See also
Configuration files:
deepwalk_flickr.yaml
line_flickr.yaml
%Labeled Data |
1% |
2% |
3% |
4% |
5% |
6% |
7% |
8% |
9 % |
10% |
|
|---|---|---|---|---|---|---|---|---|---|---|---|
Micro-F1 |
76.93 |
83.96 |
86.41 |
86.91 |
87.94 |
88.49 |
88.84 |
88.96 |
88.90 |
89.18 |
|
76.53 |
83.50 |
85.70 |
87.29 |
87.97 |
88.17 |
88.69 |
88.87 |
88.76 |
89.20 |
||
Out of Memory |
|||||||||||
Macro-F1 |
71.54 |
81.34 |
84.57 |
85.75 |
86.77 |
87.48 |
87.93 |
88.02 |
88.25 |
88.42 |
|
70.46 |
80.88 |
84.07 |
85.99 |
86.76 |
87.39 |
87.86 |
87.91 |
87.72 |
88.56 |
||
Out of Memory |
|||||||||||
See also
Configuration files:
deepwalk_friendster-small.yaml
line_friendster-small.yaml
Knowledge Graph Embedding
For knowledge graph embedding, we benchmark TransE, DistMult, ComplEx, SimplE, RotatE and QuatE on 5 standard datasets. The training time, evaluation time and resource of RotatE on these datasets are given in the following table.
Dataset |
|V| |
|E| |
|R| |
Training / Evaluation Time |
GPU memory cost |
|---|---|---|---|---|---|
15K |
483K |
1.3K |
28.1 mins / 55.8 s |
4 * 788 MiB |
|
15K |
272K |
237 |
15.3 mins / 20.8 s |
4 * 758 MiB |
|
41K |
141K |
18 |
16.4 mins / 12.0 s |
4 * 776 MiB |
|
41K |
87K |
11 |
14.8 mins / 8.98 s |
4 * 776 MiB |
|
5.0M |
21M |
828 |
2.10 hrs / 54.9 mins |
4 * 2.96 GiB |
To evaluate the knowledge graph embeddings, we test them on the link prediction task. We report the results for each model on the test set, where ranking metrics are computed based on filtered results.
MR |
MRR |
HITS@1 |
HITS@3 |
HITS@10 |
|
|---|---|---|---|---|---|
57 |
0.614 |
0.459 |
0.739 |
0.849 |
|
70 |
0.765 |
0.698 |
0.812 |
0.874 |
|
236 |
0.679 |
0.596 |
0.735 |
0.821 |
|
87 |
0.791 |
0.737 |
0.828 |
0.882 |
|
36 |
0.767 |
0.687 |
0.830 |
0.891 |
|
48 |
0.777 |
0.716 |
0.818 |
0.880 |
See also
Configuration files:
transe_fb15k.yaml
distmult_fb15k.yaml
complex_fb15k.yaml
simple_fb15k.yaml
rotate_fb15k.yaml
quate_fb15k.yaml
MR |
MRR |
HITS@1 |
HITS@3 |
HITS@10 |
|
|---|---|---|---|---|---|
172 |
0.288 |
0.190 |
0.324 |
0.487 |
|
224 |
0.295 |
0.204 |
0.329 |
0.478 |
|
372 |
0.271 |
0.184 |
0.301 |
0.447 |
|
253 |
0.284 |
0.196 |
0.315 |
0.462 |
|
201 |
0.314 |
0.218 |
0.348 |
0.506 |
|
182 |
0.304 |
0.208 |
0.339 |
0.500 |
See also
Configuration files:
transe_fb15k-237.yaml
distmult_fb15k-237.yaml
complex_fb15k-237.yaml
simple_fb15k-237.yaml
rotate_fb15k-237.yaml
quate_fb15k-237.yaml
MR |
MRR |
HITS@1 |
HITS@3 |
HITS@10 |
|
|---|---|---|---|---|---|
522 |
0.545 |
0.211 |
0.881 |
0.933 |
|
661 |
0.819 |
0.717 |
0.918 |
0.945 |
|
1262 |
0.877 |
0.857 |
0.892 |
0.909 |
|
487 |
0.944 |
0.941 |
0.946 |
0.949 |
|
303 |
0.948 |
0.924 |
0.950 |
0.957 |
|
544 |
0.947 |
0.943 |
0.950 |
0.954 |
See also
Configuration files:
transe_wn18.yaml
distmult_wn18.yaml
complex_wn18.yaml
simple_wn18.yaml
rotate_wn18.yaml
quate_wn18.yaml
MR |
MRR |
HITS@1 |
HITS@3 |
HITS@10 |
|
|---|---|---|---|---|---|
3834 |
0.219 |
0.015 |
0.398 |
0.523 |
|
5065 |
0.449 |
0.419 |
0.466 |
0.504 |
|
12602 |
0.328 |
0.312 |
0.339 |
0.353 |
|
5569 |
0.446 |
0.421 |
0.458 |
0.492 |
|
2359 |
0.500 |
0.455 |
0.518 |
0.589 |
|
5775 |
0.477 |
0.448 |
0.491 |
0.532 |
See also
Configuration files:
transe_wn18rr.yaml
distmult_wn18rr.yaml
complex_wn18rr.yaml
simple_wn18rr.yaml
rotate_wn18rr.yaml
quate_wn18rr.yaml
MR |
MRR |
HITS@1 |
HITS@3 |
HITS@10 |
|
|---|---|---|---|---|---|
109370 |
0.253 |
0.170 |
0.311 |
0.392 |
|
211030 |
0.253 |
0.209 |
0.278 |
0.334 |
|
244540 |
0.281 |
0.228 |
0.310 |
0.373 |
|
112754 |
0.296 |
0.252 |
0.317 |
0.377 |
|
89459 |
0.290 |
0.234 |
0.322 |
0.390 |
|
97372 |
0.276 |
0.227 |
0.301 |
0.359 |
See also
Configuration files:
transe_wikidata5m.yaml
distmult_wikidata5m.yaml
complex_wikidata5m.yaml
simple_wikidata5m.yaml
rotate_wikidata5m.yaml
quate_wikidata5m.yaml
Graph & High-dimensional Data Visualization
The high-dimensional data visualization is evaluated on two popular image datasets. The training time and resource needed by LargeVis is given in the following table. Note that more than 95% GPU memory cost comes from the construction of KNN Graph, and can be traded off with speed if necessary.
Dataset |
Vector |
N |
dim |
Training Time |
GPU memory cost |
|---|---|---|---|---|---|
Raw pixels |
70K |
784 |
13.9 s |
2.86 GiB |
|
ResNet50 feature |
1.33M |
2048 |
13.6 mins |
15.1 GiB |
See also
Configuration files:
largevis_mnist_2d.yaml
largevis_imagenet.yaml
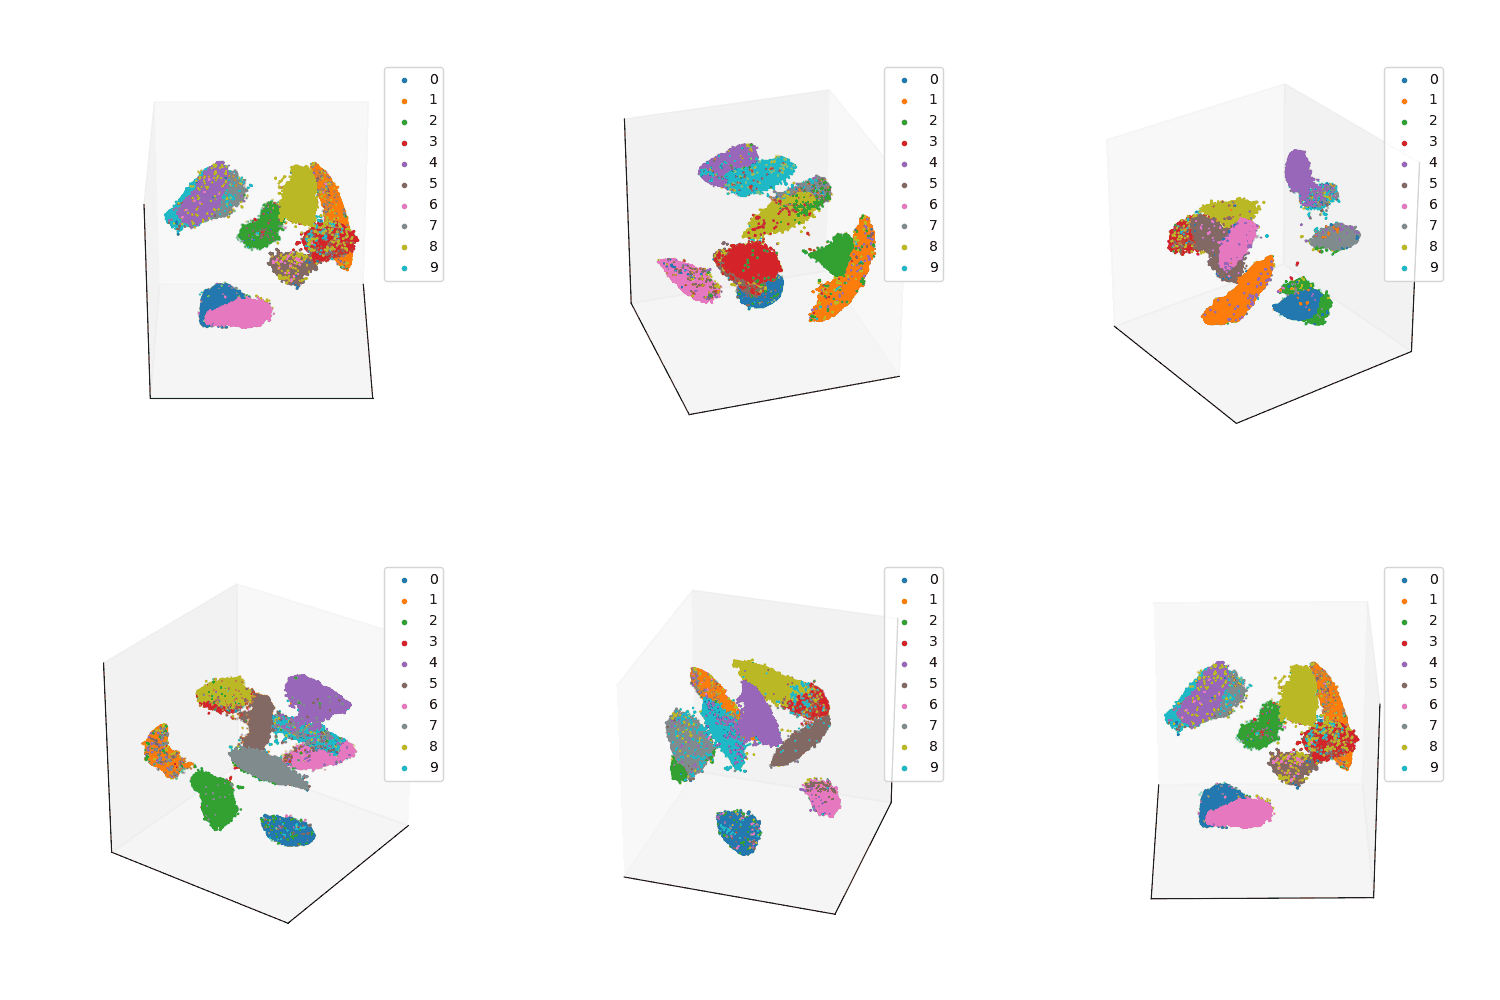
Here is a 3D visualization result of MNIST.

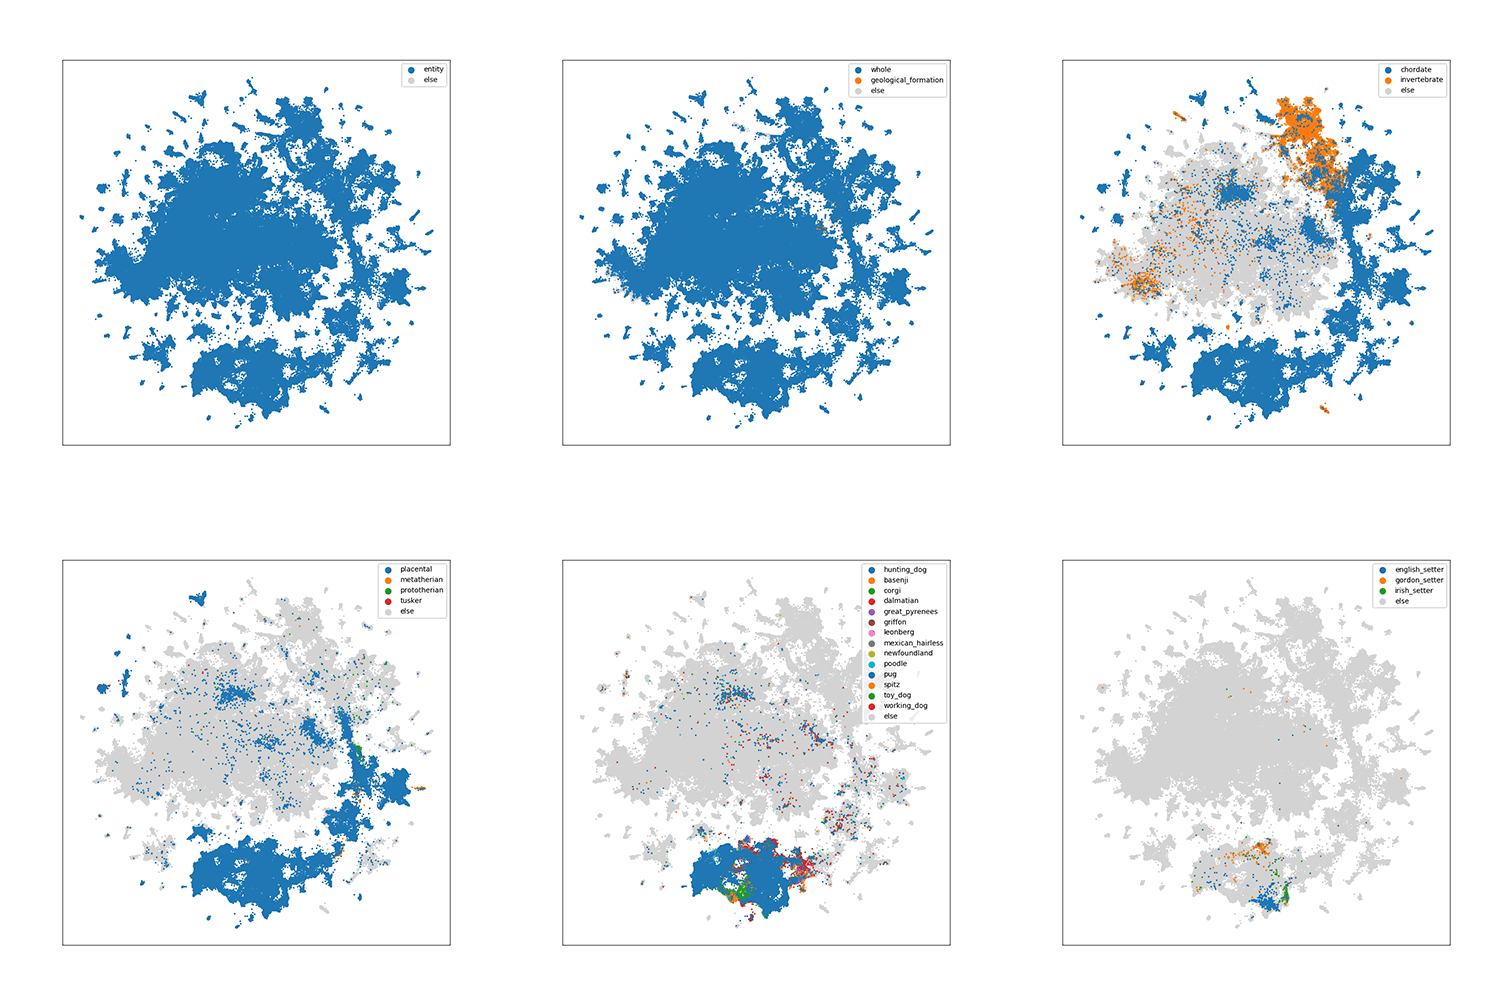
For ImageNet, since it contains 1000 classes, we visualize classes according to
their hierarchy in WordNet. The following animation shows how the class of
english setter (a kind of dog) is traversed in the hierarchy.
